Edit chart
Loading graph
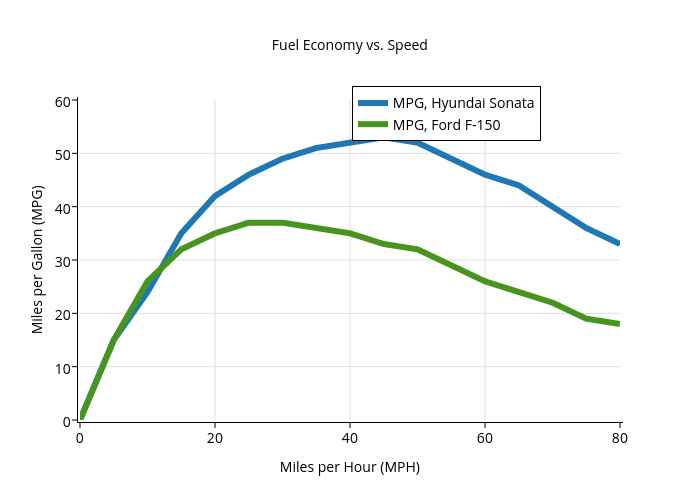
Tobytortuga's interactive graph and data of "Fuel Economy vs. Speed" is a scatter chart, showing MPG, Hyundai Sonata vs MPG, Ford F-150; with Miles per Hour (MPH) in the x-axis and Miles per Gallon (MPG) in the y-axis.. The x-axis shows values from 0 to 80. The y-axis shows values from 0 to 60.