Edit chart
Loading graph
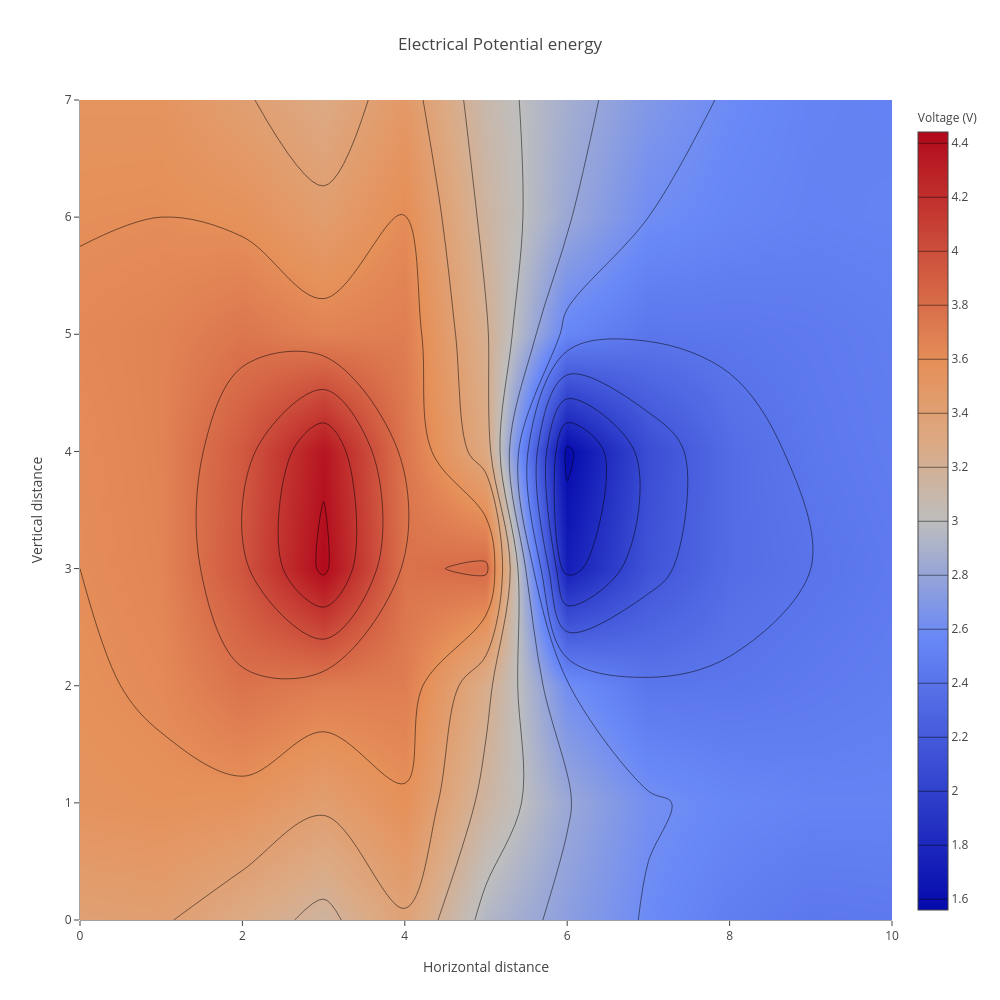
Tobiasimon's interactive graph and data of "Electrical Potential energy" is a contour, showing C; with Horizontal distance in the x-axis and Vertical distance in the y-axis.. The x-axis shows values from 0 to 10. The y-axis shows values from 0 to 7.