2
2.5
3
3.5
4
4.5
5
5.5
6
1
1.5
2
2.5
3
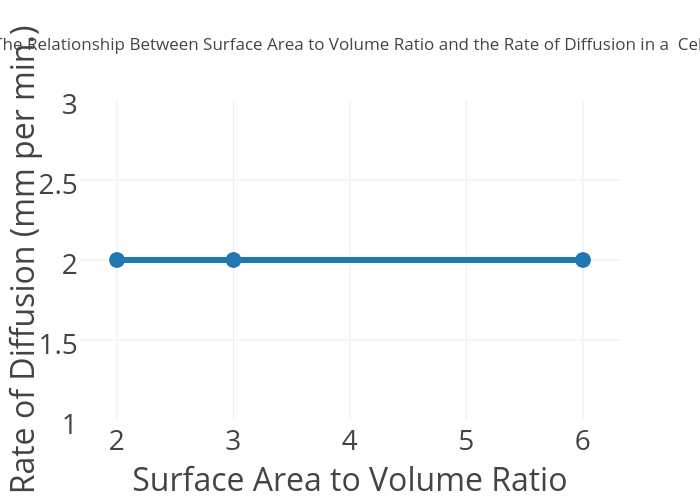
The Relationship Between Surface Area to Volume Ratio and the Rate of Diffusion in a Cell
Surface Area to Volume Ratio
Rate of Diffusion (mm per min.)
plotly-logomark
Edit chart
Thomaschin's interactive graph and data of "The Relationship Between Surface Area to Volume Ratio and the Rate of Diffusion in a Cell" is a scatter chart, showing Col2; with Surface Area to Volume Ratio in the x-axis and Rate of Diffusion (mm per min.) in the y-axis.. The x-axis shows values from 1.7428975043164336 to 6.257102495683566. The y-axis shows values from 1 to 3.