Edit chart
Loading graph
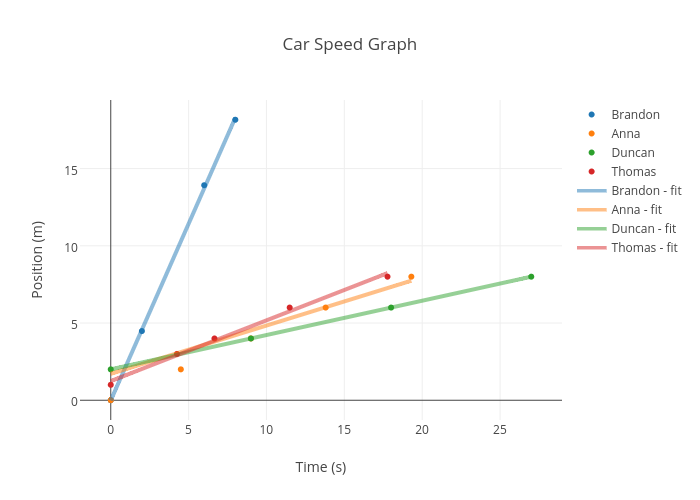
Thomas.morusiewicz's interactive graph and data of "Car Speed Graph" is a scatter chart, showing Brandon, Anna, Duncan, Thomas, Brandon - fit, Anna - fit, Duncan - fit, Thomas - fit; with Time (s) in the x-axis and Position (m) in the y-axis.. The x-axis shows values from -1.6409774436090225 to 28.64097744360902. The y-axis shows values from -1.2743859649122808 to 19.43438596491228.