Edit chart
Loading graph
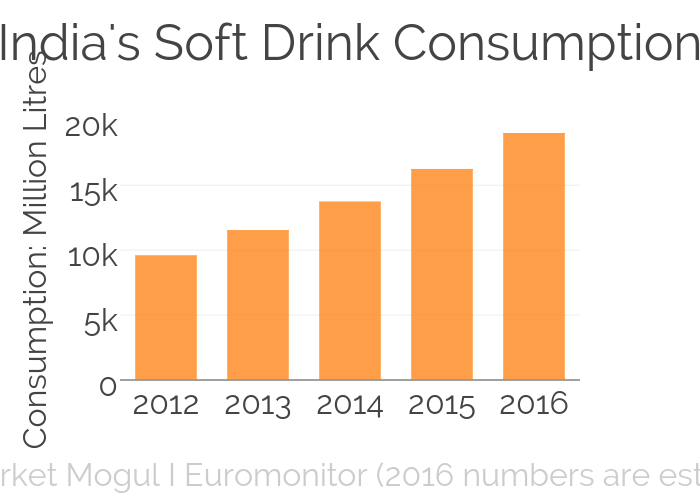
Tmm's interactive graph and data of "India's Soft Drink Consumption" is a bar chart, showing Consumption; with The Market Mogul I Euromonitor (2016 numbers are estimates) in the x-axis and Consumption: Million Litres in the y-axis.. The x-axis shows values from 2011.5 to 2016.5. The y-axis shows values from 0 to 20021.36842105263.