Edit chart
Loading graph
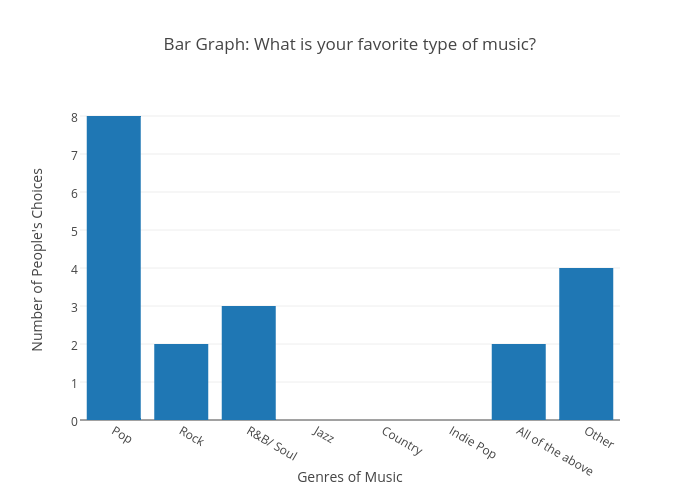
Student_100's interactive graph and data of "Bar Graph: What is your favorite type of music?" is a bar chart, showing Col2; with Genres of Music in the x-axis and Number of People's Choices in the y-axis.. The x-axis shows values from -0.5 to 7.5. The y-axis shows values from 0 to 8.421052631578947.