Edit chart
Loading graph
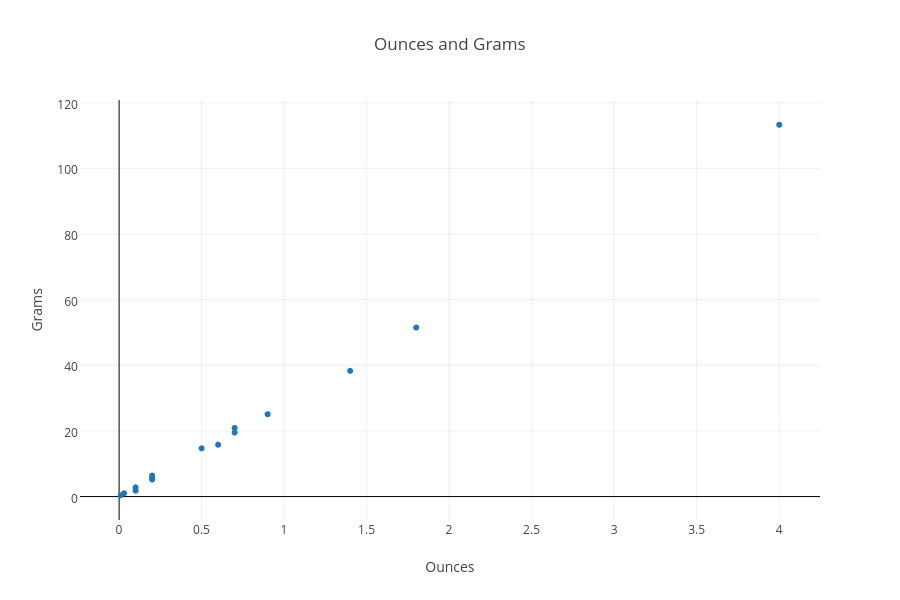
Star62600's interactive graph and data of "Ounces and Grams" is a scatter chart, showing Col2; with Ounces in the x-axis and Grams in the y-axis.. The x-axis shows values from -0.23691343963553532 to 4.246913439635535. The y-axis shows values from -7.141902834008096 to 120.8419028340081.