Edit chart
Loading graph
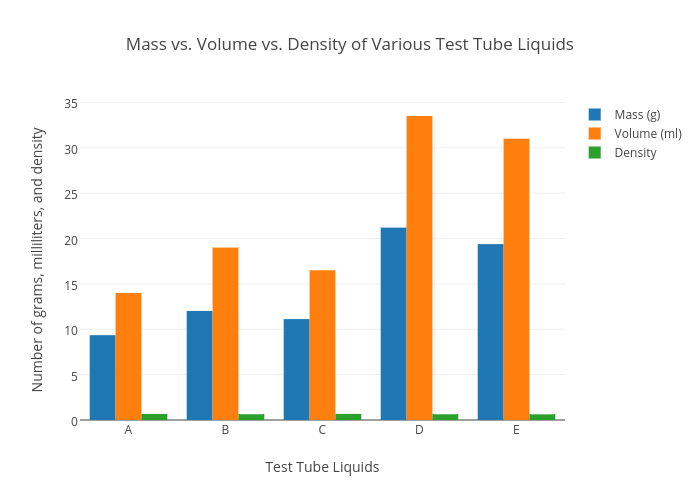
Scottacious's interactive graph and data of "Mass vs. Volume vs. Density of Various Test Tube Liquids" is a bar chart, showing Mass (g), Volume (ml), Density; with Test Tube Liquids in the x-axis and Number of grams, milliliters, and density in the y-axis.. The x-axis shows values from -0.5 to 4.5. The y-axis shows values from 0 to 35.26315789473684.