Edit chart
Loading graph
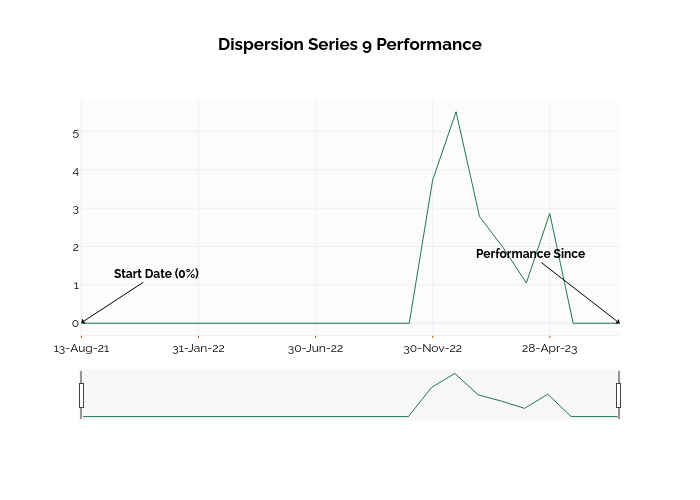
Ssi_plotly's interactive graph and data of "Dispersion Series 9 Performance" is a line chart; with in the x-axis. The x-axis shows values from -0.06111928785067959 to 23. The y-axis shows values from -0.3061111111111111 to 5.816111111111111. This visualization has the following annotations: Performance Since; Start Date (0%)