Edit chart
Loading graph
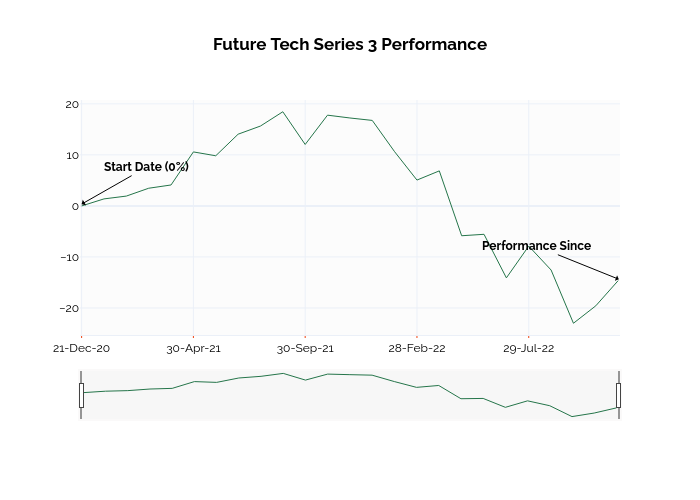
Ssi_plotly's interactive graph and data of "Future Tech Series 3 Performance" is a line chart; with in the x-axis. The x-axis shows values from -0.07223455839795409 to 24.082077669138258. The y-axis shows values from -25.292777777777776 to 20.762777777777778. This visualization has the following annotations: Start Date (0%); Performance Since