Edit chart
Loading graph
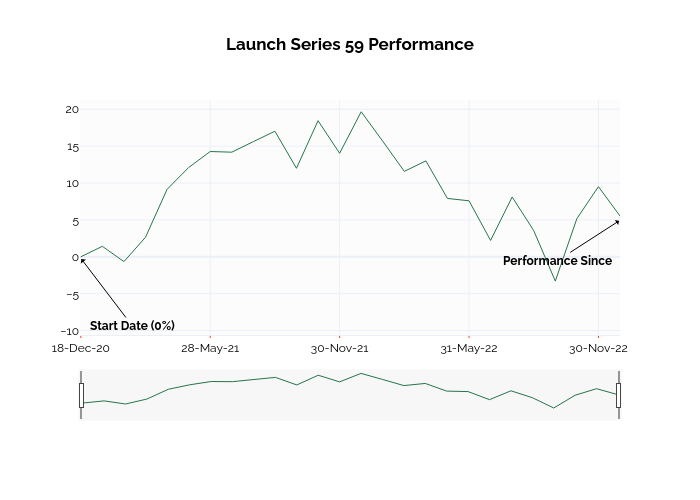
Ssi_plotly's interactive graph and data of "Launch Series 59 Performance" is a line chart; with in the x-axis. The x-axis shows values from -0.037046273205874225 to 25. The y-axis shows values from -21.031683754057173 to 21.801667566003008. This visualization has the following annotations: Start Date (0%); Performance Since