Edit chart
Loading graph
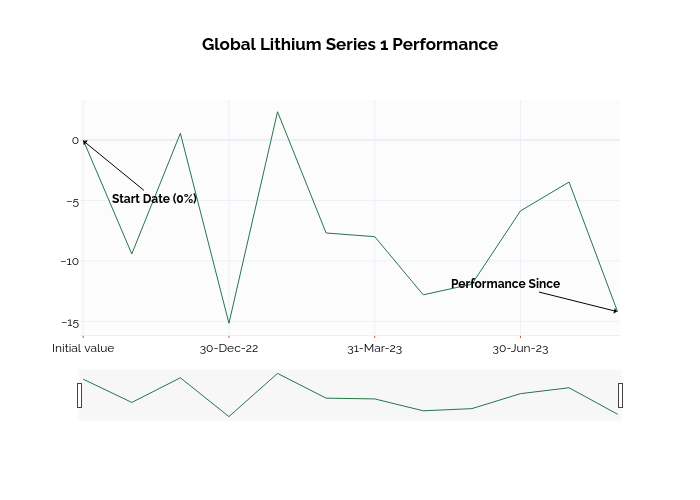
Ssi_plotly's interactive graph and data of "Global Lithium Series 1 Performance" is a line chart; with in the x-axis. The x-axis shows values from -0.01671307258103235 to 11.00404022833401. The y-axis shows values from -16.121111111111112 to 3.301111111111111. This visualization has the following annotations: Start Date (0%); Performance Since