Edit chart
Loading graph
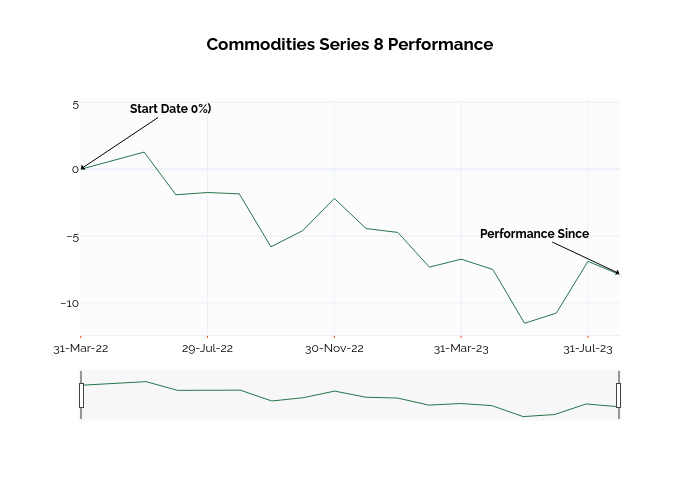
Ssi_plotly's interactive graph and data of "Commodities Series 8 Performance" is a line chart; with in the x-axis. The x-axis shows values from -0.023474018624394105 to 17.010820845683437. The y-axis shows values from -12.30347205975566 to 3.085969135357526. This visualization has the following annotations: Start Date 0%); Performance Since