Edit chart
Loading graph
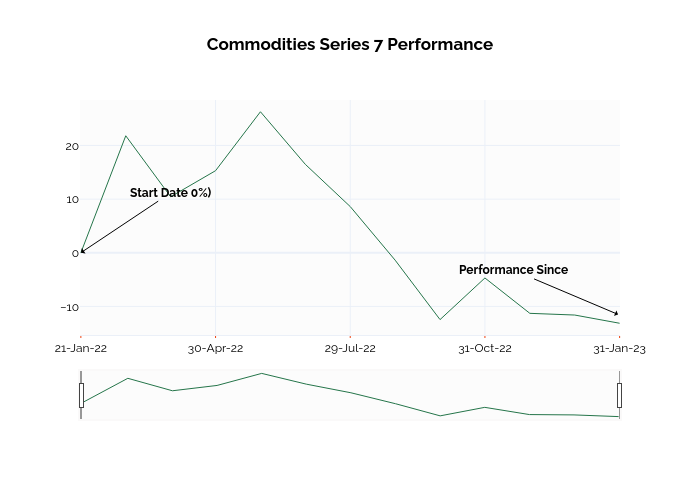
Ssi_plotly's interactive graph and data of "Commodities Series 7 Performance" is a line chart. The x-axis shows values from -0.019234610942914846 to 12.008353533416575. The y-axis shows values from -15.330555555555556 to 28.480555555555554. This visualization has the following annotations: Start Date 0%); Performance Since