0
20
40
60
80
100
Victoria
Tasmania
New South Wales
South Australia
Queensland
Australian Capital Territory
Western Australia
Northern Territory
Rate per 100,000 young people
102.4
27.9
18.9
25.2
17.3
18.1
10.8
5.7
plotly-logomark
Edit chart
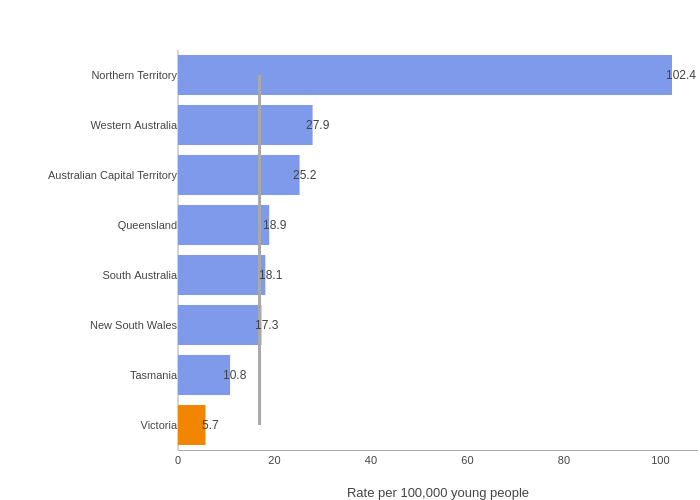
Sac's interactive graph and data of " " is a bar chart; with Rate per 100,000 young people in the x-axis. The x-axis shows values from 0 to 107.78947368421053. The y-axis shows values from -0.5166447656592204 to 7.516644765659221. This visualization has the following annotations: 102.4; 27.9; 18.9; 25.2; 17.3; 18.1; 10.8; 5.7