Edit chart
Loading graph
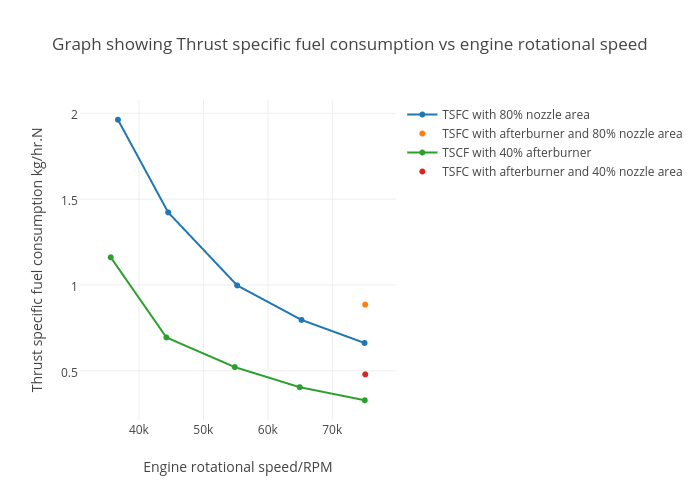
Rosedeladoucette's interactive graph and data of "Graph showing Thrust specific fuel consumption vs engine rotational speed" is a scatter chart, showing TSFC with 80% nozzle area , TSFC with afterburner and 80% nozzle area, TSCF with 40% afterburner, TSFC with afterburner and 40% nozzle area; with Engine rotational speed/RPM in the x-axis and Thrust specific fuel consumption kg/hr.N in the y-axis.. The x-axis shows values from 33233.67886178862 to 77481.32113821138. The y-axis shows values from 0.2196090216 to 2.0710941244.