Edit chart
Loading graph
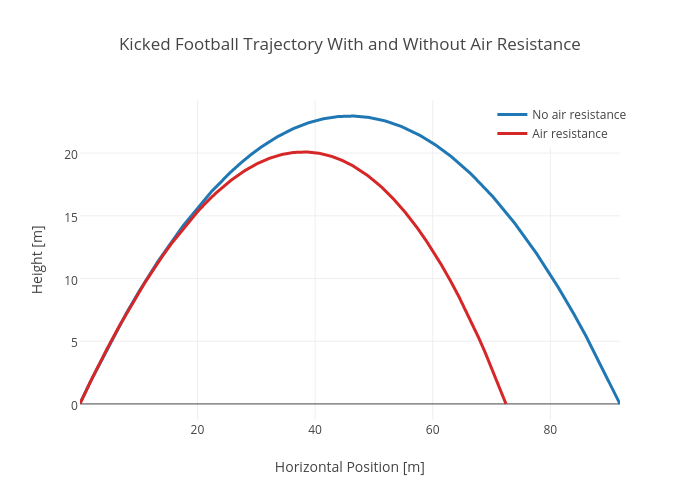
Rhettallain's interactive graph and data of "Kicked Football Trajectory With and Without Air Resistance" is a scatter chart, showing No air resistance vs Air resistance; with Horizontal Position [m] in the x-axis and Height [m] in the y-axis.. The x-axis shows values from 0.02121071485309674 to 91.8319576726882. The y-axis shows values from -1.2822694140748065 to 24.23441232140593.