Edit chart
Loading graph
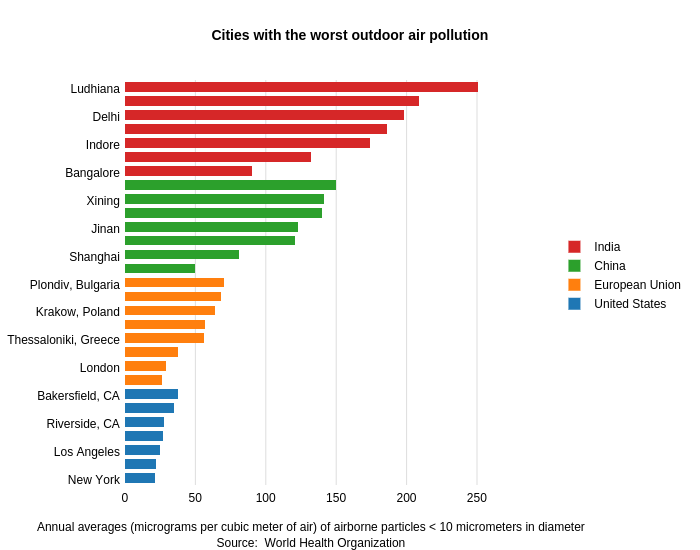
Readthebox's interactive graph and data of "Cities with the worst outdoor air pollution" is a stacked bar chart, showing United States, European Union, China, India; with Annual averages (micrograms per cubic meter of air) of airborne particles Source: World Health Organization in the x-axis. The x-axis shows values from 0 to 264.2105263157895. The y-axis shows values from -0.5 to 29.5.