Edit chart
Loading graph
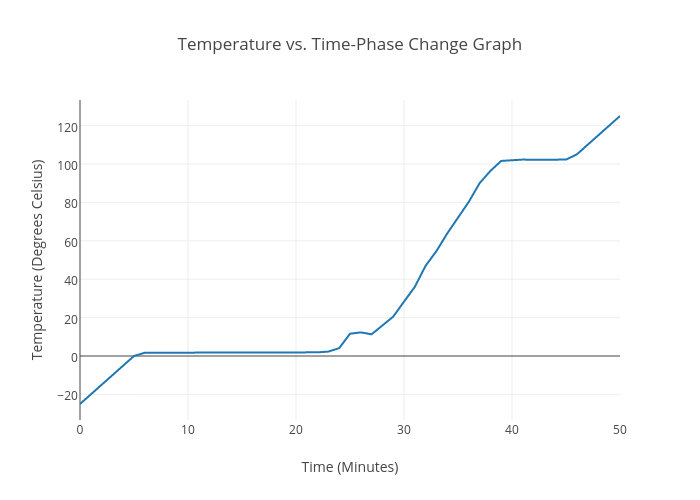
Raygerner's interactive graph and data of "Temperature vs. Time-Phase Change Graph" is a scatter chart, showing Col2; with Time (Minutes) in the x-axis and Temperature (Degrees Celsius) in the y-axis.. The x-axis shows values from 0 to 50. The y-axis shows values from -33.333333333333336 to 133.33333333333334.