Edit chart
Loading graph
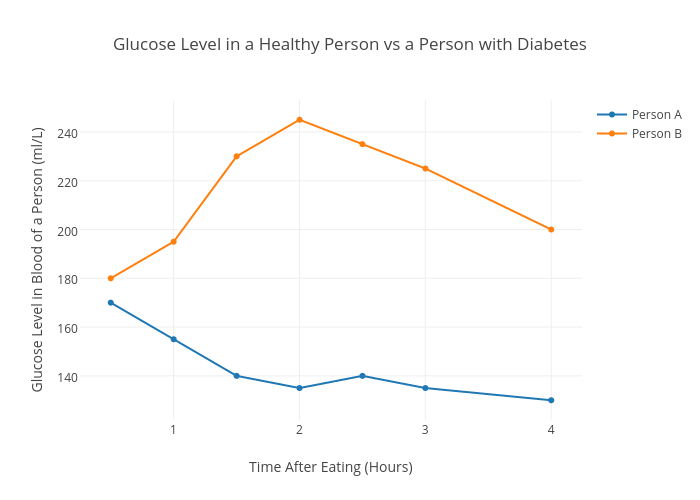
Rachelmount's interactive graph and data of "Glucose Level in a Healthy Person vs a Person with Diabetes" is a scatter chart, showing Person A vs Person B; with Time After Eating (Hours) in the x-axis and Glucose Level in Blood of a Person (ml/L) in the y-axis.. The x-axis shows values from 0.27208380520951303 to 4.227916194790487. The y-axis shows values from 121.79195140470767 to 253.20804859529233.