Edit chart
Loading graph
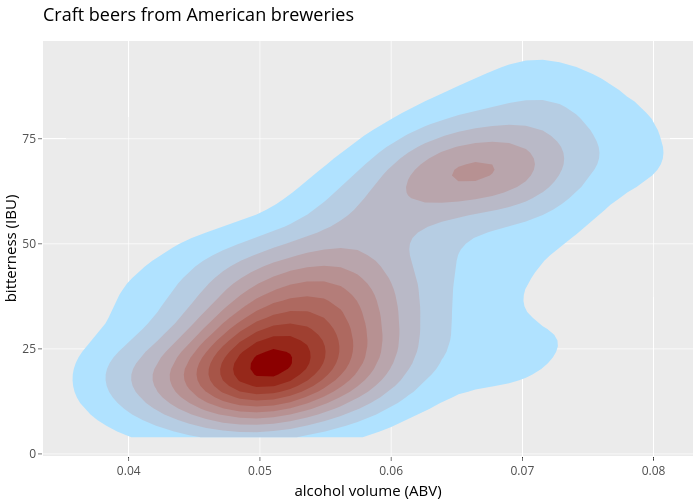
Rplotbot's interactive graph and data of "Craft beers from American breweries" is a filled line chart; with alcohol volume (ABV) in the x-axis and bitterness (IBU) in the y-axis.. The x-axis shows values from 0.0334678559229117 to 0.0830039229212655. The y-axis shows values from -0.489448892126976 to 98.2784267346665.