Edit chart
Loading graph
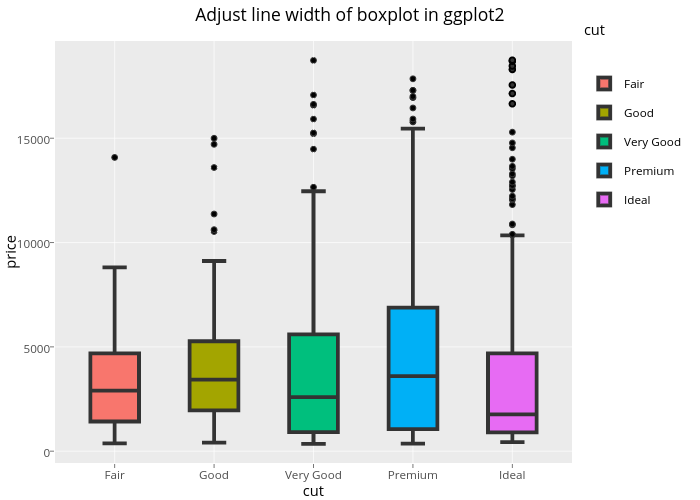
Rplotbot's interactive graph and data of "Adjust line width of boxplot in ggplot2" is a box plot, showing Fair, Good, Very Good, Premium, Ideal; with cut in the x-axis and price in the y-axis.. The x-axis shows values from 0.4 to 5.6. The y-axis shows values from -566.4 to 19660.4. This visualization has the following annotation: cut