Edit chart
Loading graph
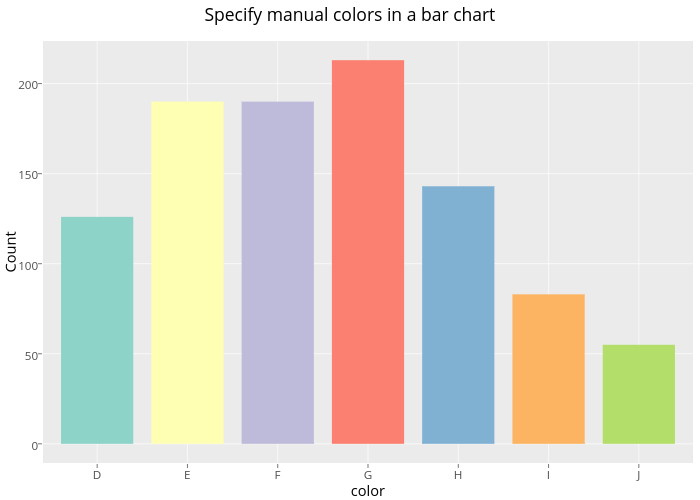
Rplotbot's interactive graph and data of "Specify manual colors in a bar chart" is a bar chart, showing []; with color in the x-axis and Count in the y-axis.. The x-axis shows values from 0.4 to 7.6. The y-axis shows values from -10.65 to 223.65.