Edit chart
Loading graph
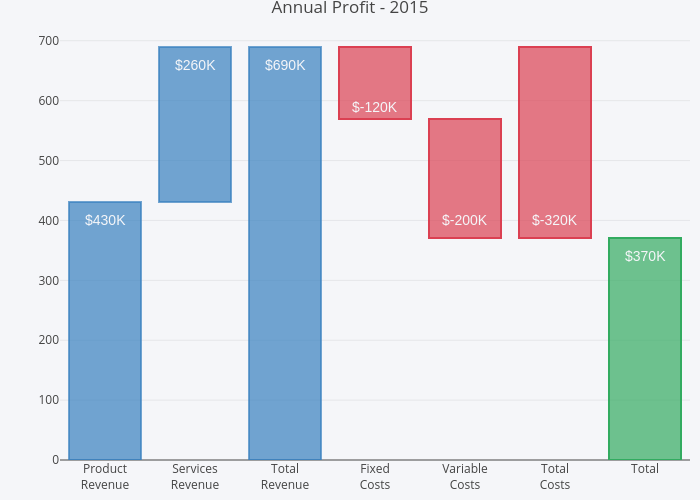
Rplotbot's interactive graph and data of "Annual Profit - 2015" is a stacked bar chart. The x-axis shows values from 0 to 0. The y-axis shows values from 0 to 0. This visualization has the following annotations: $430K; $260K; $690K; $-120K; $-200K; $-320K; $370K