Edit chart
Loading graph
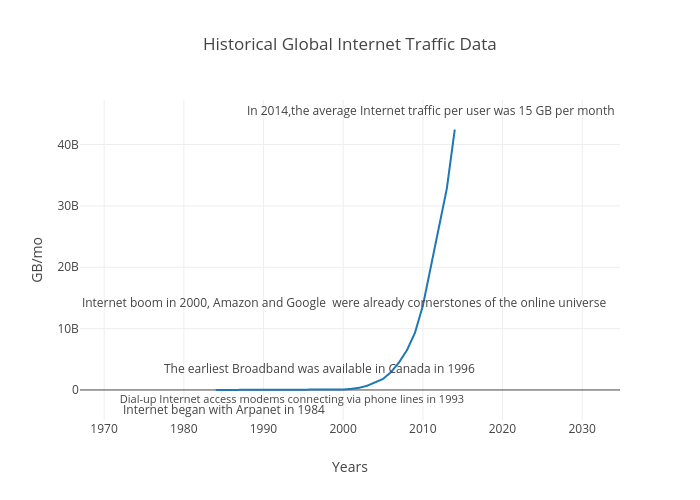
Qy's interactive graph and data of "Historical Global Internet Traffic Data" is a line chart, showing GB/mo; with Years in the x-axis and GB/mo in the y-axis.. The x-axis shows values from 1980.6400818875766 to 2018.8612513265336. The y-axis shows values from -4354823125.427568 to 46707960883.44196. This visualization has the following annotations: Internet began with Arpanet in 1984; Dial-up Internet access modems connecting via phone lines in 1993; The earliest Broadband was available in Canada in 1996; In 2014,the average Internet traffic per user was 15 GB per month ; Internet boom in 2000, Amazon and Google were already cornerstones of the online universe