Edit chart
Loading graph
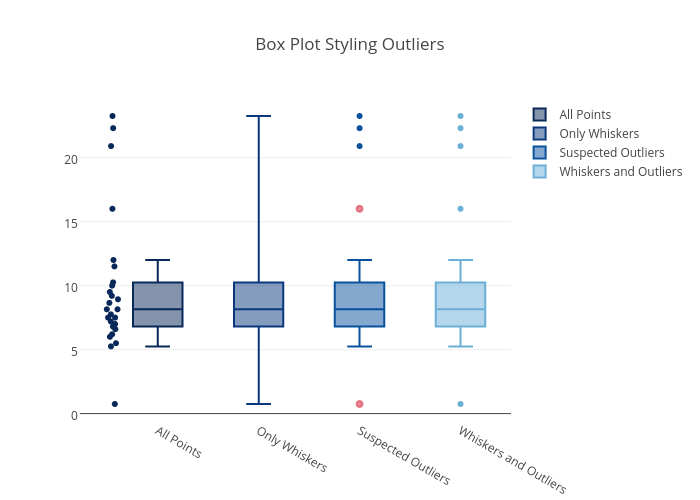
Pythonplotbot's interactive graph and data of "Box Plot Styling Outliers" is a box plot, showing All Points, Only Whiskers, Suspected Outliers, Whiskers and Outliers. The x-axis shows values from 0 to 0. The y-axis shows values from 0 to 0.