Edit chart
Loading graph
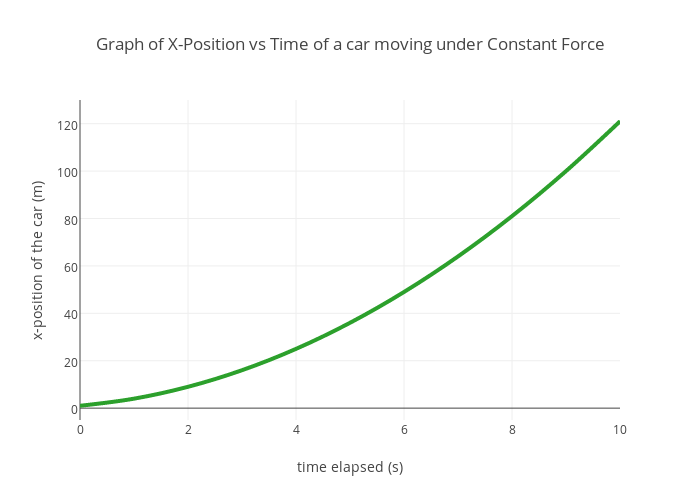
Perlatmsu's interactive graph and data of "Graph of X-Position vs Time of a car moving under Constant Force" is a scatter chart, showing Col4; with time elapsed (s) in the x-axis and x-position of the car (m) in the y-axis.. The x-axis shows values from 0 to 10. The y-axis shows values from -5 to 130.