Edit chart
Loading graph
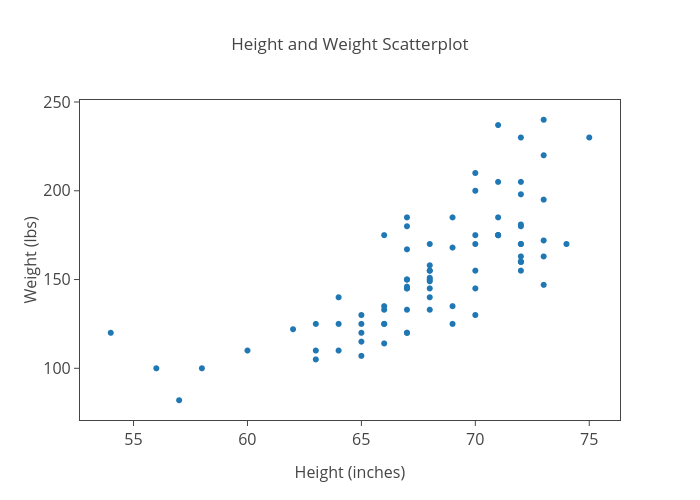
Oli_stanford's interactive graph and data of "Height and Weight Scatterplot" is a scatter chart, showing Weight; with Height (inches) in the x-axis and Weight (lbs) in the y-axis.. The x-axis shows values from 52.766360505166475 to 76.23363949483353. The y-axis shows values from 72.10488798370672 to 249.89511201629327.