Edit chart
Loading graph
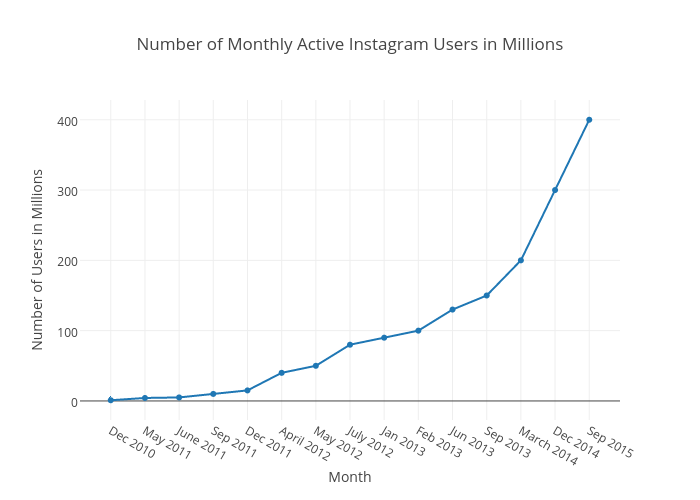
Nikhilc1's interactive graph and data of "Number of Monthly Active Instagram Users in Millions" is a scatter chart, showing Col2; with Month in the x-axis and Number of Users in Millions in the y-axis.. The x-axis shows values from -0.8714859437751005 to 14.8714859437751. The y-axis shows values from -28.87413073713491 to 429.8741307371349.