Edit chart
Loading graph
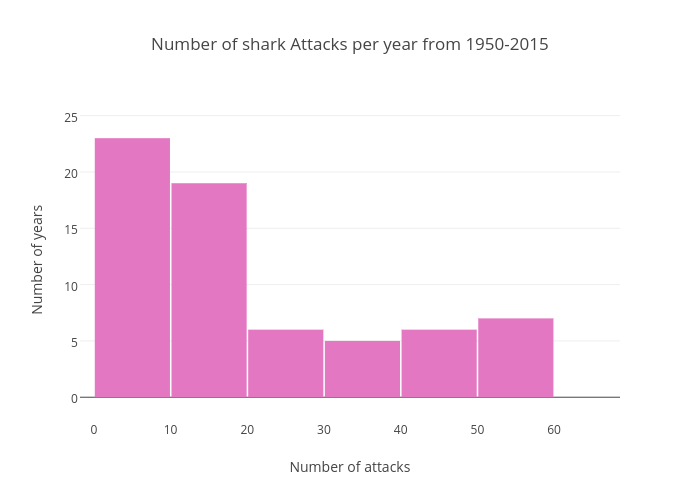
Newtellacoutur's interactive graph and data of "Number of shark Attacks per year from 1950-2015" is a histogram, showing Number of attacks; with Number of attacks in the x-axis and Number of years in the y-axis.. The x-axis shows values from -1.8294146914310403 to 68.58123756807746. The y-axis shows values from -2.0218353093890595 to 26.389480514623145.