Edit chart
Loading graph
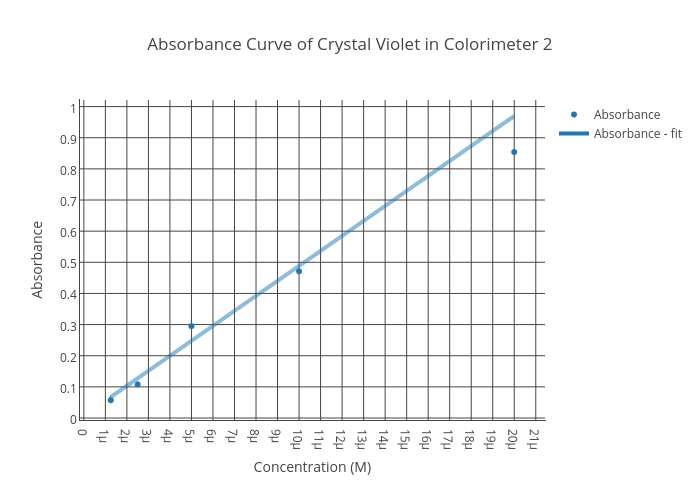
Natorator's interactive graph and data of "Absorbance Curve of Crystal Violet in Colorimeter 2" is a scatter chart, showing Absorbance vs Absorbance - fit; with Concentration (M) in the x-axis and Absorbance in the y-axis.. The x-axis shows values from 1.0840368380660005e-07 to 2.11415963161934e-05. The y-axis shows values from -0.005119936289554844 to 1.0210841156399821.