Edit chart
Loading graph
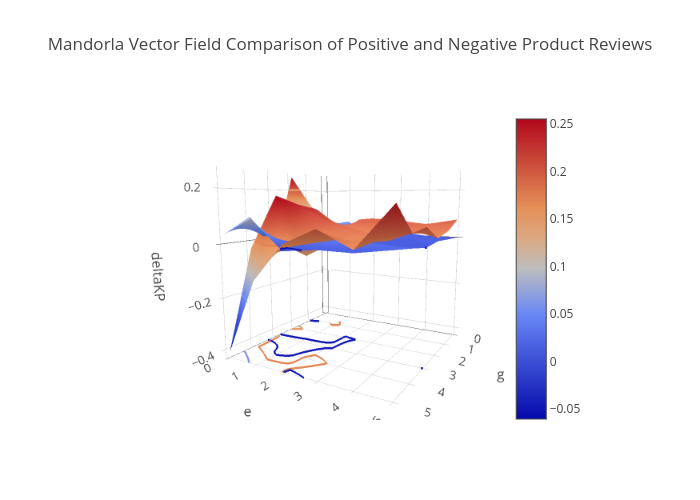
Nahko's interactive graph and data of "Mandorla Vector Field Comparison of Positive and Negative Product Reviews" is a surface, showing Positive vs Negative. The x-axis shows values from 0 to 0. The y-axis shows values from 0 to 0.