Edit chart
Loading graph
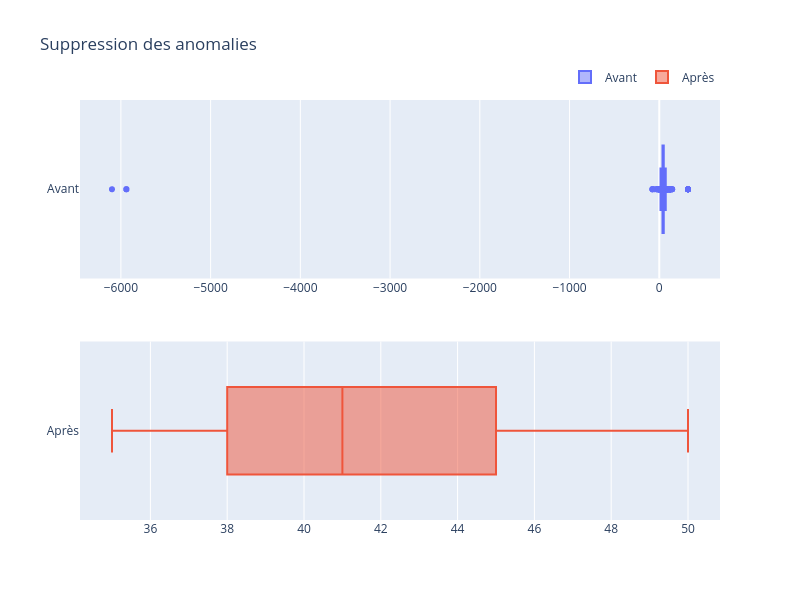
Mulah_moriah's interactive graph and data of "Suppression des anomalies " is a box plot, showing Avant vs Après. The x-axis shows values from 0 to 0. The y-axis shows values from 0 to 0.