Edit chart
Loading graph
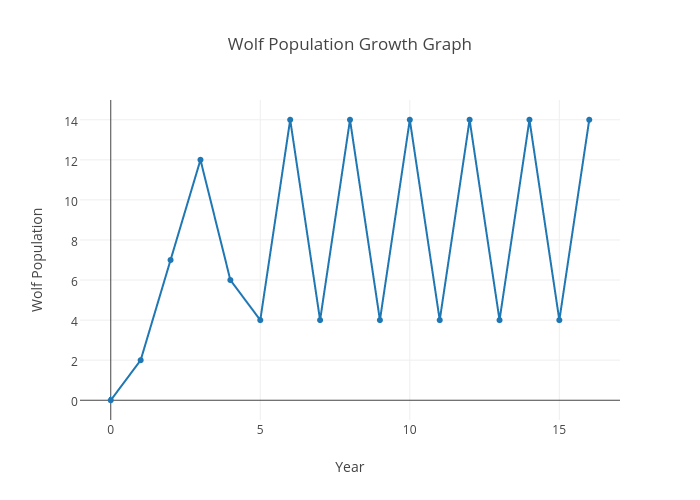
Moshab's interactive graph and data of "Wolf Population Growth Graph" is a scatter chart, showing Col2; with Year in the x-axis and Wolf Population in the y-axis.. The x-axis shows values from -0.9684813753581663 to 16.968481375358166. The y-axis shows values from -0.96420581655481 to 14.96420581655481.