Edit chart
Loading graph
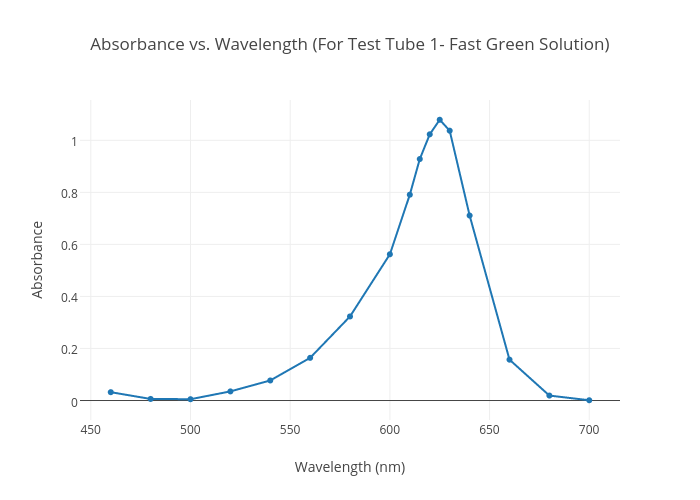
Michelleha's interactive graph and data of "Absorbance vs. Wavelength (For Test Tube 1- Fast Green Solution)" is a scatter chart, showing Absorbance; with Wavelength (nm) in the x-axis and Absorbance in the y-axis.. The x-axis shows values from 445.3558788832088 to 714.6441211167912. The y-axis shows values from -0.07459951031829312 to 1.154599510318293.