Edit chart
Loading graph
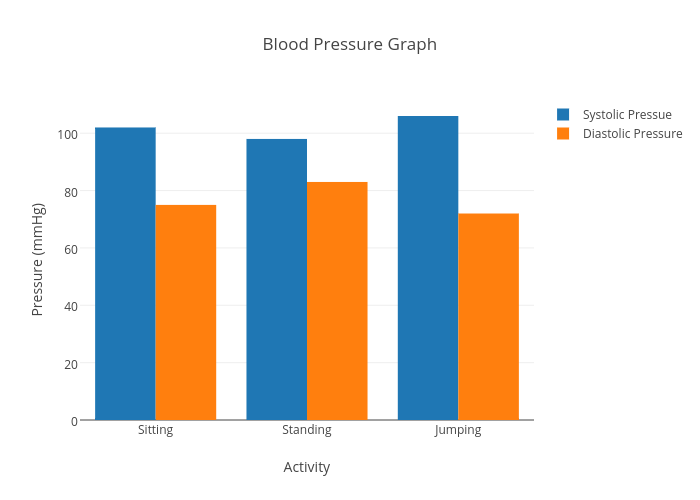
Michaelw's interactive graph and data of "Blood Pressure Graph" is a bar chart, showing Systolic Pressue vs Diastolic Pressure; with Activity in the x-axis and Pressure (mmHg) in the y-axis.. The x-axis shows values from -0.5 to 2.5. The y-axis shows values from 0 to 111.57894736842105.