Edit chart
Loading graph
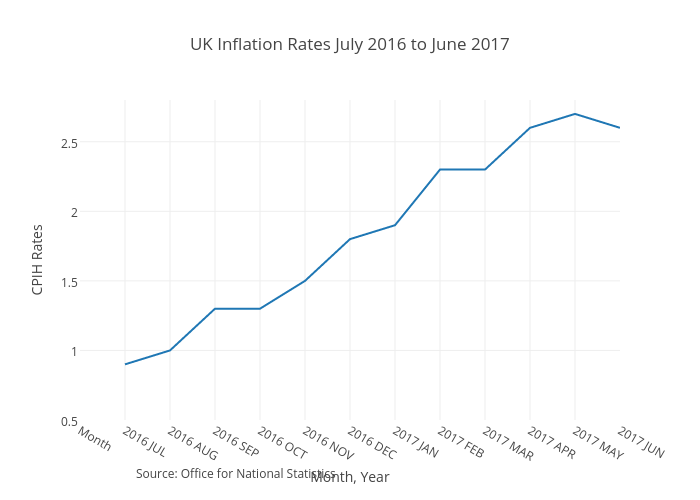
Michaelokeje's interactive graph and data of "UK Inflation Rates July 2016 to June 2017" is a line chart, showing B; with Month, Year in the x-axis and CPIH Rates in the y-axis.. The x-axis shows values from 0 to 12. The y-axis shows values from 0.5 to 2.8000000000000003. This visualization has the following annotation: Source: Office for National Statistics