Edit chart
Loading graph
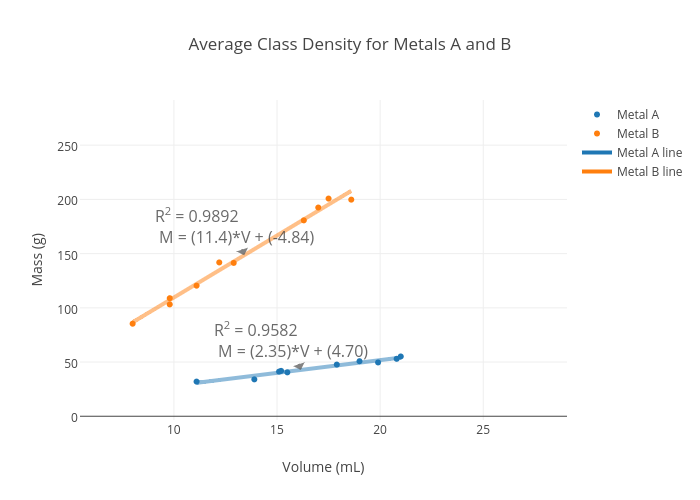
Micche's interactive graph and data of "Average Class Density for Metals A and B" is a scatter chart, showing Metal A, Metal B, Metal A line, Metal B line; with Volume (mL) in the x-axis and Mass (g) in the y-axis.. The x-axis shows values from 5.448562408035992 to 29.05980258377795. The y-axis shows values from -3.466269478930357 to 291.674333246687. This visualization has the following annotations: R2 = 0.9582 M = (2.35)*V + (4.70); R2 = 0.9892 M = (11.4)*V + (-4.84)