Edit chart
Loading graph
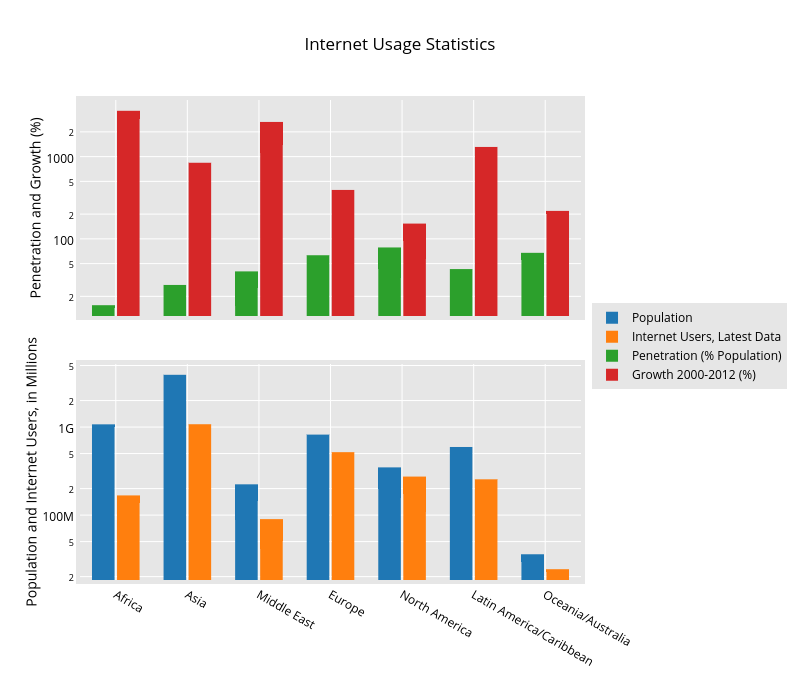
Matthewsundquist's interactive graph and data of "Internet Usage Statistics" is a grouped bar chart, showing Population, Internet Users, Latest Data, Penetration (% Population), Growth 2000-2012 (%); with Population and Internet Users, in Millions in the y-axis. The x-axis shows values from -0.5 to 6.5. The y-axis shows values from 7.262716711344759 to 9.716188601438711.