Edit chart
Loading graph
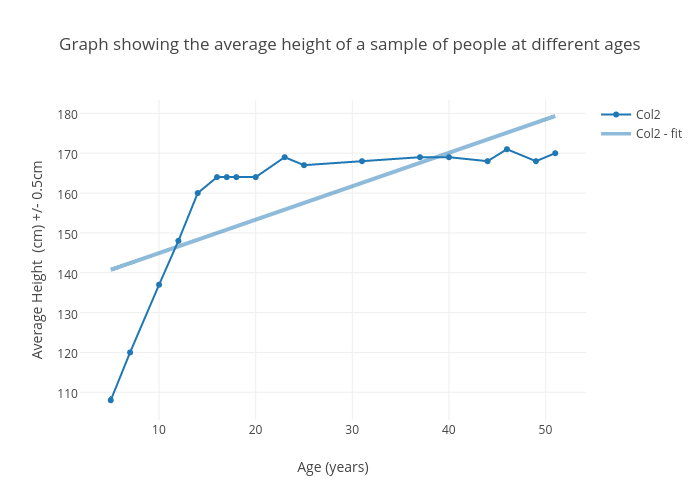
Maryam_h's interactive graph and data of "Graph showing the average height of a sample of people at different ages" is a line chart, showing Col2 vs Col2 - fit; with Age (years) in the x-axis and Average Height (cm) +/- 0.5cm in the y-axis.. The x-axis shows values from 2.082057099640765 to 53.917942900359236. The y-axis shows values from 102.97963944444368 to 183.35881642436138.