Edit chart
Loading graph
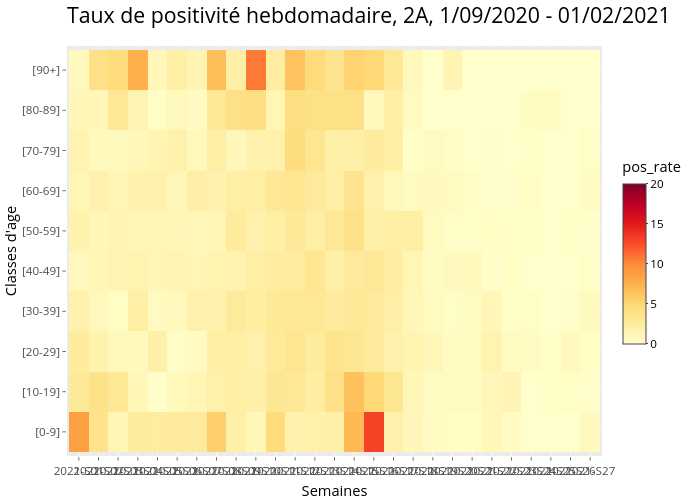
Marco_faure's interactive graph and data of "Taux de positivité hebdomadaire, 2A, 1/09/2020 - 01/02/2021" is a heatmap, showing 99_481c6fb44661a41f203a5f6ccc48ebcc; with Semaines in the x-axis and Classes d'age in the y-axis.. The x-axis shows values from 0.4 to 27.6. The y-axis shows values from 0.4 to 10.6.