Edit chart
Loading graph
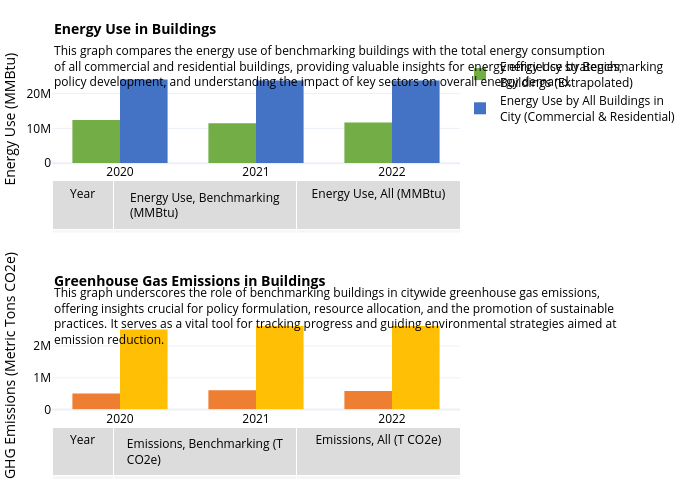
Mfmechenich's interactive graph and data of "Energy Use by BenchmarkingBuildings (Extrapolated), Energy Use by All Buildings inCity (Commercial & Residential), Energy Use, GHG Emissions from Bench-marking Buildings (Extrapolated), Citywide GHG Emissions, GHG Emissions" is a bar chart, showing Energy Use by BenchmarkingBuildings (Extrapolated), Energy Use by All Buildings inCity (Commercial & Residential), Energy Use, GHG Emissions from Bench-marking Buildings (Extrapolated), Citywide GHG Emissions, GHG Emissions; with Energy Use (MMBtu) in the y-axis. The x-axis shows values from 2019.5 to 2022.5. The y-axis shows values from 0 to 25233135.789473683. This visualization has the following annotations: Energy Use in Buildings; Greenhouse Gas Emissions in Buildings; This graph compares the energy use of benchmarking buildings with the total energy consumptionof all commercial and residential buildings, providing valuable insights for energy efficiency strategies,policy development, and understanding the impact of key sectors on overall energy demand.; This graph underscores the role of benchmarking buildings in citywide greenhouse gas emissions,offering insights crucial for policy formulation, resource allocation, and the promotion of sustainablepractices. It serves as a vital tool for tracking progress and guiding environmental strategies aimed atemission reduction.