Edit chart
Loading graph
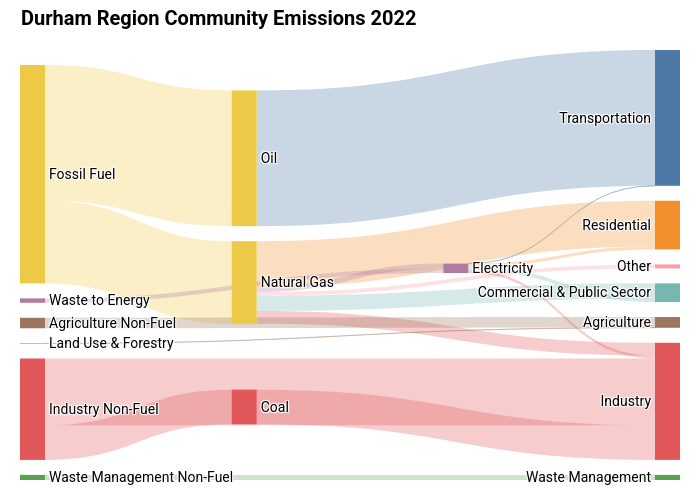
Mfmechenich's interactive graph and data of "Durham Region Community Emissions 2022" is a sankey. The x-axis shows values from 0 to 0. The y-axis shows values from 0 to 0.