Edit chart
Loading graph
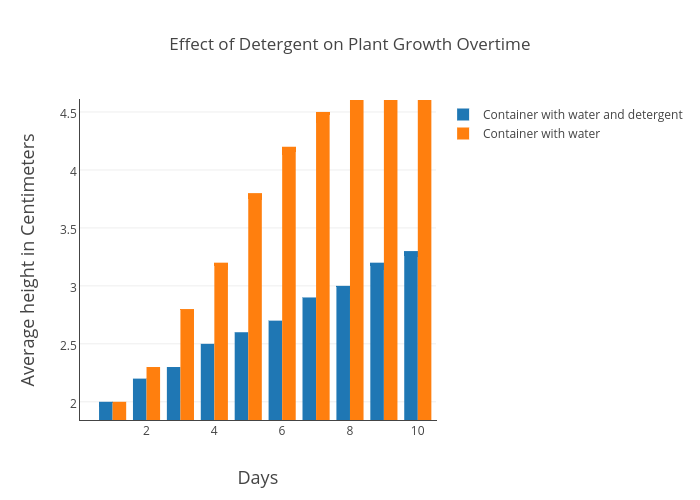
Luketapp's interactive graph and data of "Effect of Detergent on Plant Growth Overtime" is a bar chart, showing Container with water and detergent vs Container with water; with Days in the x-axis and Average height in Centimeters in the y-axis.. The x-axis shows values from 0.03825857519788922 to 10.536873533646641. The y-axis shows values from 1.8429471161851056 to 4.603223485047397.