Edit chart
Loading graph
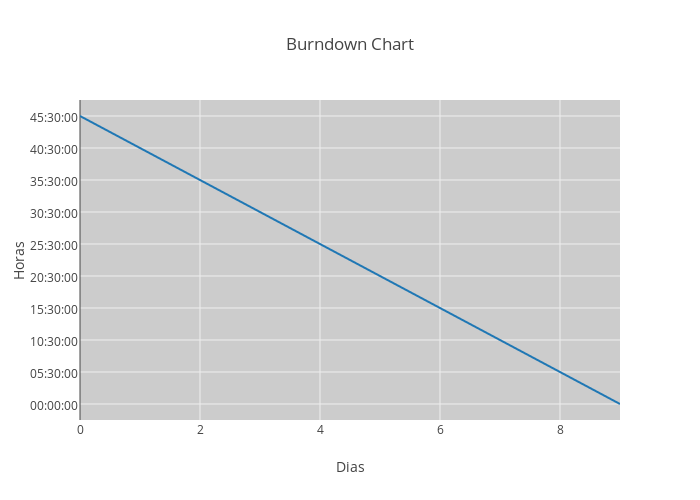
Lucasmarques's interactive graph and data of "Burndown Chart" is a line chart, showing Col1; with Dias in the x-axis and Horas in the y-axis.. The x-axis shows values from 0 to 9. The y-axis shows values from 9.5 to -0.49999999999999994.