Edit chart
Loading graph
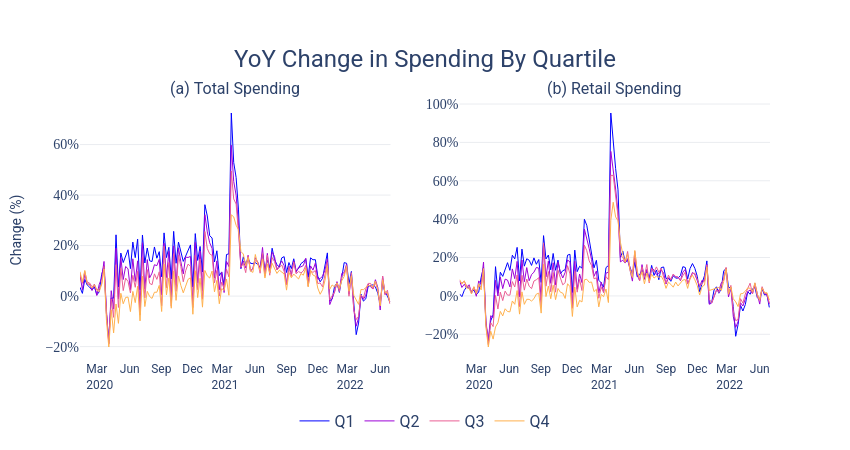
Loujaina's interactive graph and data of "YoY Change in Spending By Quartile" is a line chart, showing Q1, Q2, Q3, Q4, Q1, Q2, Q3, Q4; with Change (%) in the y-axis. The x-axis shows values from 2020-01-08 to 2022-07-01. The y-axis shows values from 0 to 0. This visualization has the following annotations: (a) Total Spending; (b) Retail Spending