Edit chart
Loading graph
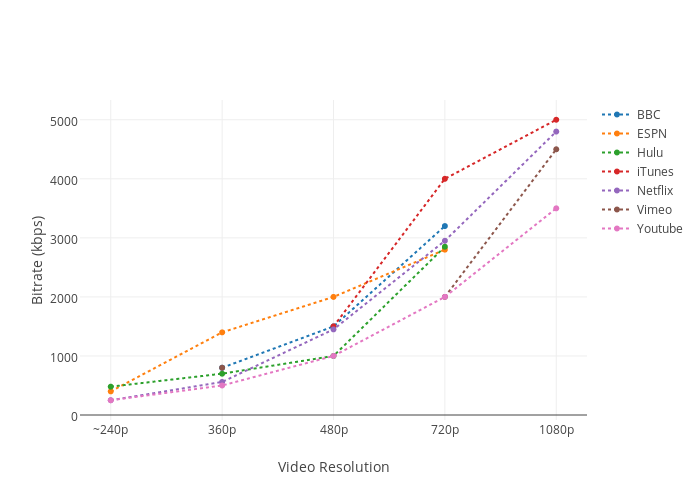
Lonewolf's interactive graph and data of "Bitrate (kbps) vs Video Resolution" is a scatter chart, showing BBC, ESPN, Hulu, iTunes, Netflix, Vimeo, Youtube; with Video Resolution in the x-axis and Bitrate (kbps) in the y-axis.. The x-axis shows values from -0.24503764544832307 to 4.245037645448323. The y-axis shows values from -62.5768757687577 to 5312.576875768757.