Edit chart
Loading graph
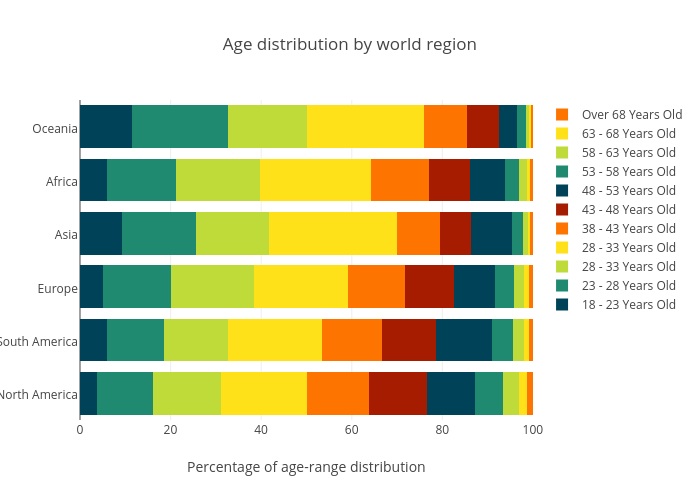
Leowguojun's interactive graph and data of "Age distribution by world region" is a stacked bar chart, showing 18 - 23 Years Old, 23 - 28 Years Old, 28 - 33 Years Old, 28 - 33 Years Old, 38 - 43 Years Old, 43 - 48 Years Old, 48 - 53 Years Old, 53 - 58 Years Old, 58 - 63 Years Old, 63 - 68 Years Old, Over 68 Years Old; with Percentage of age-range distribution in the x-axis. The x-axis shows values from 0 to 100. The y-axis shows values from -0.5 to 5.5.