Edit chart
Loading graph
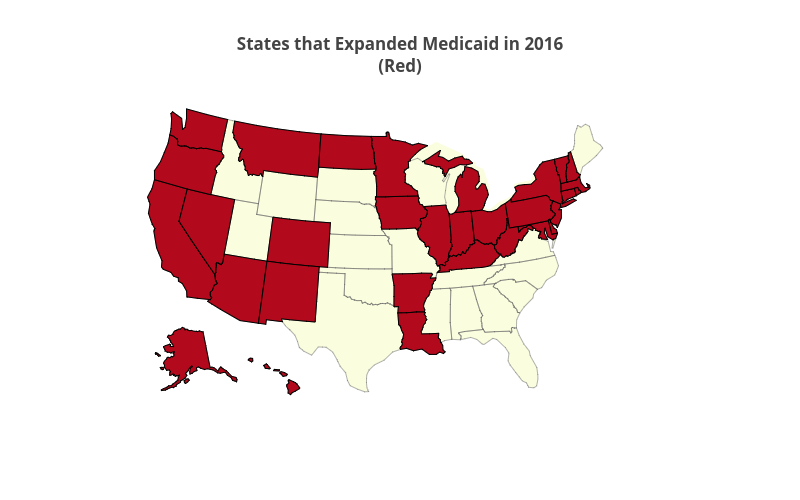
Kdc323's interactive graph and data of "States that Expanded Medicaid in 2016(Red)" is a choropleth, showing With Medicaid Expansion vs Without Medicaid Expansion. The x-axis shows values from 0 to 0. The y-axis shows values from 0 to 0.