2013
2014
2015
2016
2017
0
20
40
60
80
100
うな丼 (JP)
カツ丼 (JP)
しらす丼 (JP)
牛丼 (JP)
天丼 (JP)
Interest over time
Date
Search hits
legend
plotly-logomark
Edit chart
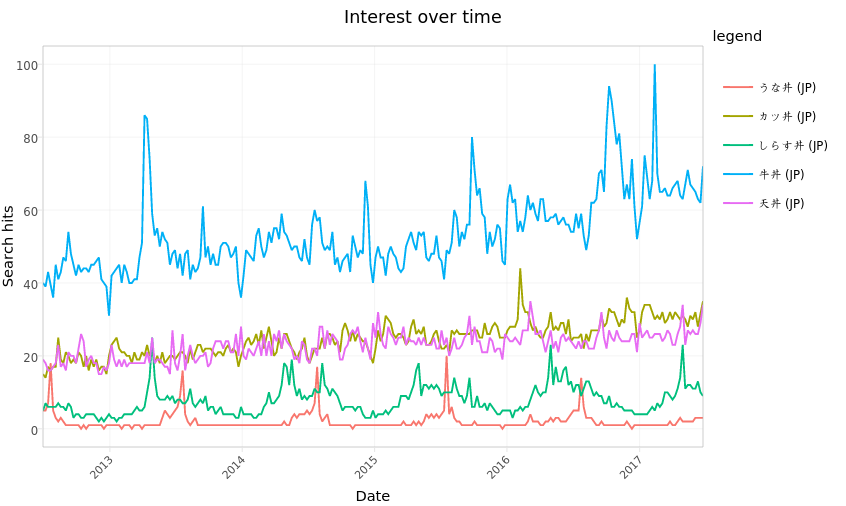
Jirosakamoto's interactive graph and data of "Interest over time" is a line chart, showing うな丼 (JP), カツ丼 (JP), しらす丼 (JP), 牛丼 (JP), 天丼 (JP); with Date in the x-axis and Search hits in the y-axis.. The x-axis shows values from 1341068400000 to 1498316400000. The y-axis shows values from -5 to 105. This visualization has the following annotation: legend